About the SVG Chart Generator
The SVG chart generator is an online tool that helps designers create placeholder charts for their UI.
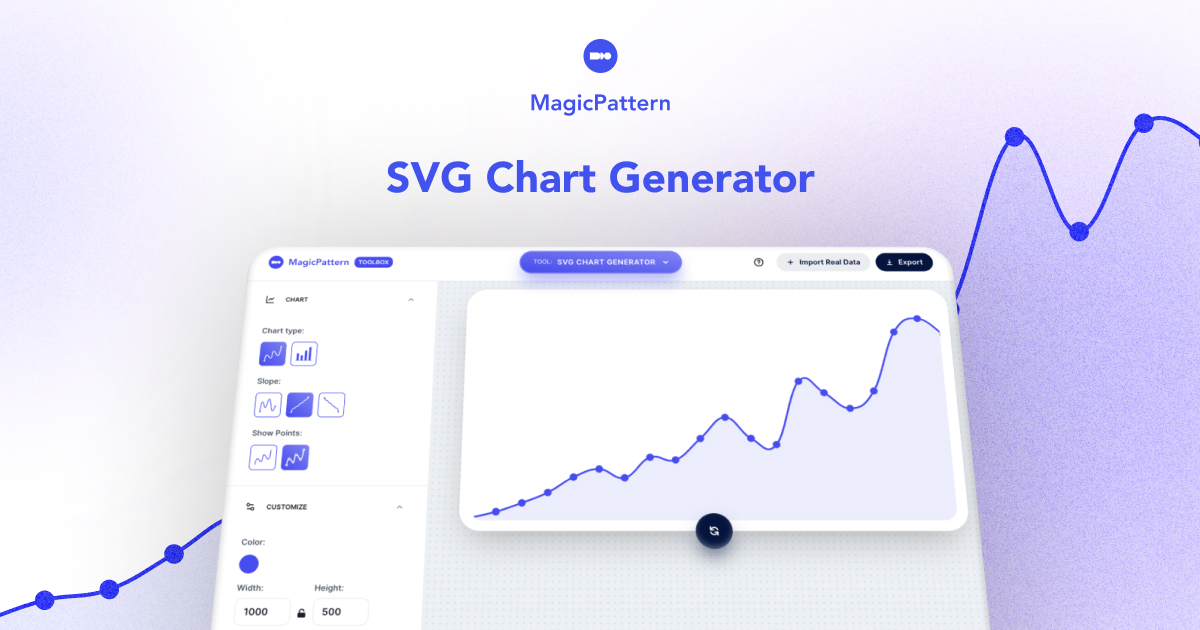
You can customize the SVG appearance and choose between 2 chart types, line and bar (more in the future).
Why do I need a graph generator?
You can easily create placeholder graphs for your design and presentations. The purpose is not to trick anyone, but create visual context for your designs!
SVG line chart generator
The SVG line chart generator creates a fake line chart with specific attributes like a positive or negative slope. You're able to customize colors, number of data points, and many more. In the future, you'll be able to import your own data to create the chart.
SVG bar chart generator
The SVG bar chart generator creates a fake bar chart with specific attributes like a positive or negative slope. You're able to customize colors, number of data points, and many more. In the future, you'll be able to import your own data to create the chart.
What can I create with the SVG chart generator?
Generate clean SVG line and bar charts to use as placeholder graphs in landing pages, product mockups, marketing decks and dashboard UI designs.
Can I export charts as SVG?
Yes. Charts are rendered as scalable SVG so they stay crisp at any size. Download SVG or copy directly into your design tool of choice.
Is the SVG chart generator free?
Yes. The SVG chart generator is free to use online. Pro plans unlock watermark-free exports.